
By Hank Sattlethight, Aluminum Association.
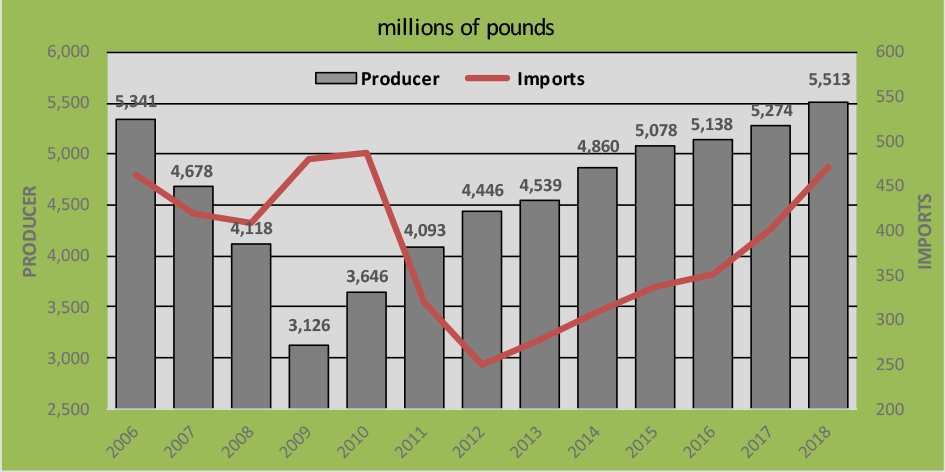
The aluminum extrusion industry in the U.S. and Canada shipped 5.51 billion lbs of extruded products in 2018 and surpassed the industry peak shipments of 2006 by more than 3% (Figure 1). Domestic demand for extruded products, which includes imports, totaled 5.65 billion lbs in 2018, up 5% over 2017 and slightly higher than 2006. This is the ninth consecutive year that demand has increased.
“Surpassing its highpoint in 2006 is a great milestone for the aluminum extrusion industry. The numbers clearly show expanded utilization of aluminum extrusions in the transportation sector driven by new applications in the automotive industry,” said Jeff Henderson, president of the Aluminum Extruders Council (AEC). “Meanwhile, building and construction demand has held up even though building starts continue to be well below their peaks in 2006. The construction industry’s shift to thermally enhanced extrusions and growing demand in commercial building have maintained this end use segment as the largest consumers of aluminum extrusions. Other new applications in industrial, electrical, and renewable energy continue to report growth as well.”
“Extrusions are a critical segment of the aluminum industry value chain in the U.S. and we are pleased to see continued demand growth,” added Heidi Brock, president and ceo of the Aluminum Association. “Extrusions represent nearly 30% of all aluminum industry jobs in the U.S.—our single largest segment.”
Markets
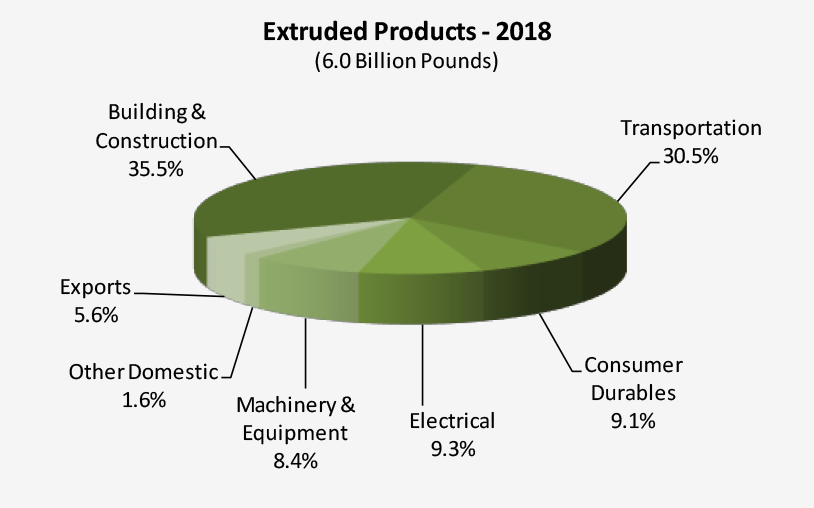
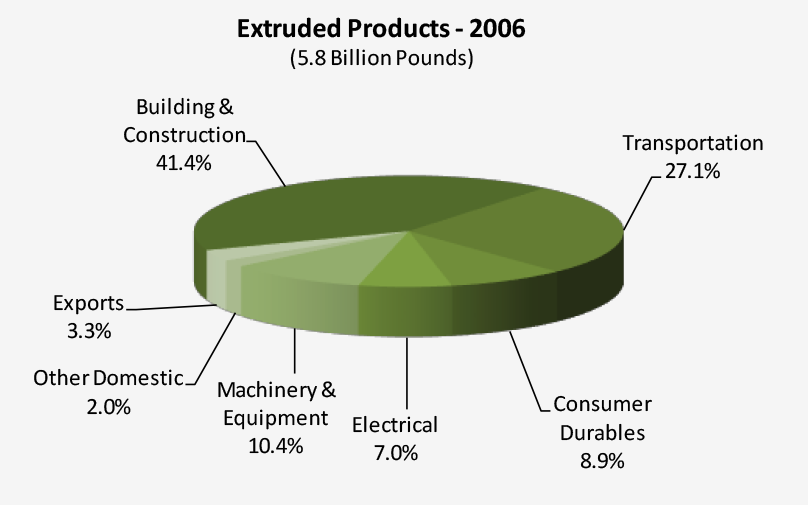
Shipments of extruded products to domestic markets increased across all sectors in 2018 (Figure 2). Building and construction continues as the largest market sector for extruded products, although not as significant as a percentage of total shipments in 2006 (Figure 3). Transportation is the second largest market sector and shipments to this sector have grown by 16% since 2006. Other important market sectors for extruded products are consumer durables, machinery and equipment, electrical, and exports.
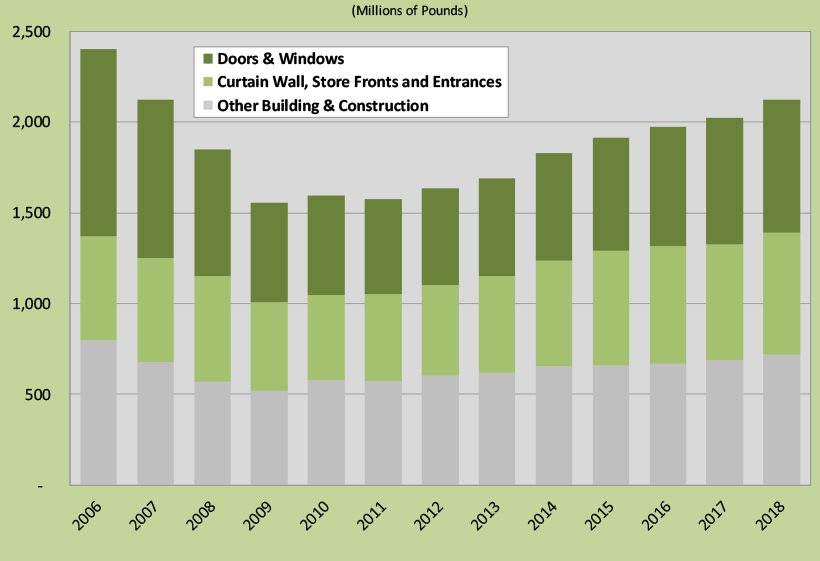
Shipments to building and construction totaled 2.12 billion lbs in 2018. Doors and windows represented 34.5% of total shipments to this sector, while curtain wall, storefront, and entrances were 31.6% of shipments (Figure 4). Other significant sectors include: bridge, street, and highway; awnings and canopies; sunrooms and patio enclosures; railing and support systems; and shower and tub enclosures.
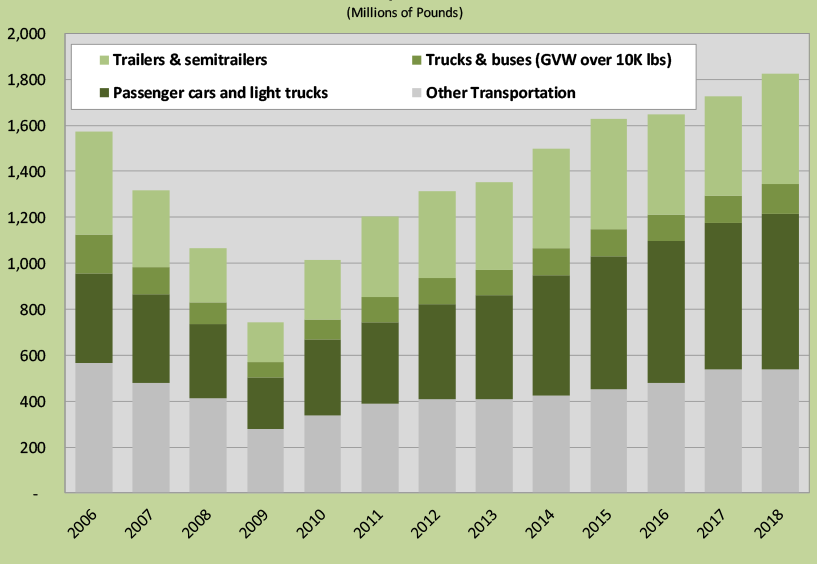
Shipments to transportation totaled 1.82 billion lbs in 2018. Auto and light truck represented 31.8% of shipments to this sector, and trailer and semitrailer represented 22.5% of shipments (Figure 5). Auto and light truck is the principal growth market for extruded products and shipments to this sector have grown by more than 72% since 2006. Other important sectors include: truck and bus, travel trailers and recreational vehicles, military vehicles, and aircraft and aerospace.
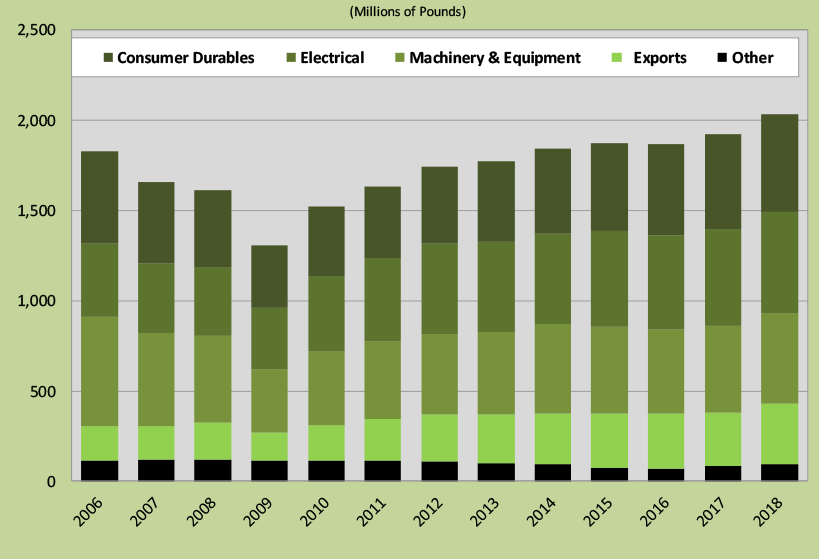
Other major markets include consumer durables, electrical, machinery and equipment, and exports (Figure 6). Sub-markets within consumer durables include: air conditioners, appliances, furniture, outboard motors and pleasure boats, and sporting goods. Sub-markets within electrical and machinery and equipment include: power transmission and distribution, solar and other forms of renewable energy, bus bar, and ladders and scaffolding.
Extrusion Press Utilization
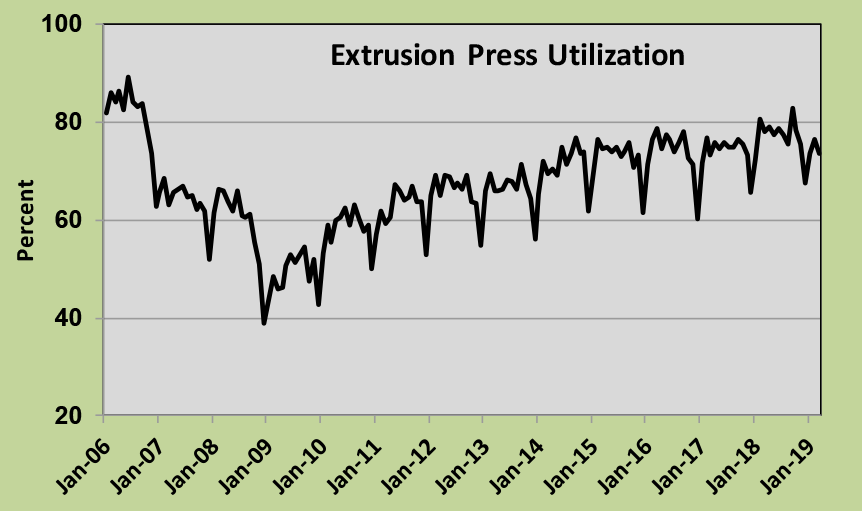
Extrusion press utilization averaged 77% during 2018 (Figure 7). This is nearly three points higher than 2017, but more than four points lower than the average for 2006. Smaller presses that use billet of 7 inches or less operated at less than 50% of capacity in 2018, while presses that used billet of 12 inches or greater operated at more than 90% of capacity. There were about 496 extrusion presses operating in the U.S. and Canada at the end of 2018, compared to 485 at the end of 2016.
Billet Supply and Demand
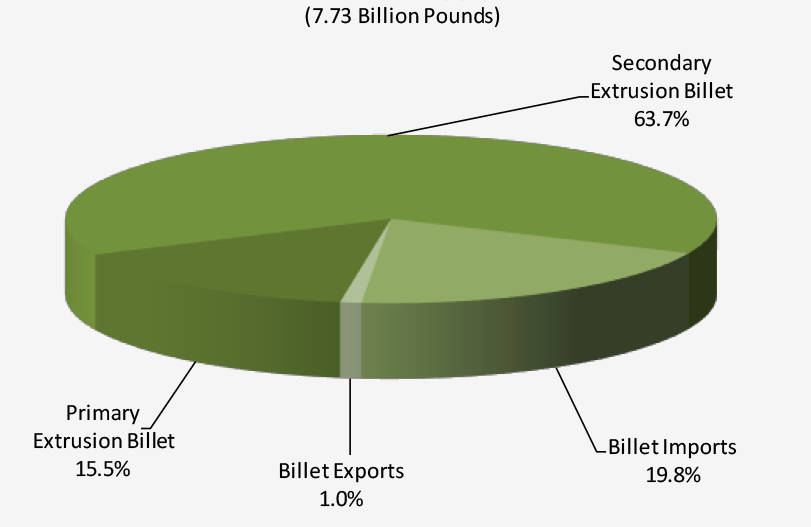
Domestic demand for extrusion billet reached an all-time high in 2018, totaling 7.65 billion lbs (Figure 8). Production of secondary billet by domestic producers totaled 4.92 billion lbs, also an all-time high. Production of primary billet and imports amounted to 1.20 and 1.53 billion lbs, respectively. Exports to countries outside of the U.S. and Canada were recorded at 81 million lbs.
Foreign Trade
“The aluminum industry in the United States is committed to free, fair, and open trade with partners who play by the rules,” Brock said. “That’s why the Aluminum Association, along with our partners at the AEC, have focused on targeted trade enforcement efforts in markets where unfairly subsidized aluminum from China is hurting companies and workers.”
Imports into the U.S. and Canada, excluding cross border trade, continued to rise in 2018 and totaled 472 million lbs. Import penetration, which is measured as a share of domestic producer shipments less exports, grew to 8.4% in 2018, compared to 7.5% in 2017. Peak imports were recorded in 2010 at 488 million lbs. The top five source countries for imports during 2018 include: Mexico, Vietnam, Malaysia, Indonesia, and China. While not for domestic consumption, U.S. and Canadian producers also exported 337 million lbs of extruded products, which represents 6.1% of total producer shipments. Customers in Mexico accounted for more than 70% of exports.
“We are looking closely at growing imports into the North American market,” added Henderson. “While the mix of countries exporting to the U.S. has changed a bit, the pattern is familiar to extruders. All in all, 2018 was a breakout year for aluminum extrusion consumption and demonstrates the effectiveness of the massive capital investment made in this industry since it won its trade case against the Chinese.”
Background
Aluminum Association statistics are based on the results of surveys conducted by the Aluminum Association in cooperation with the AEC, as well as estimates developed by the members of the Association’s Statistical and Market Research Committee. The Association’s monthly surveys during 2018 accounted for about 63% of industry shipments. The annual end use survey for 2018, which the Association conducts in cooperation with the members of the AEC, accounted for nearly 74% of domestic producer shipments. Both organizations give their thanks to the domestic producers that participated in the statistical reporting program.
Editor’s Note: This article first appeared in the June 2019 issue of Light Metal Age. To receive the current issue, please subscribe.